How to Read a Company's Income Statement in Pakistan: A Beginner's Guide
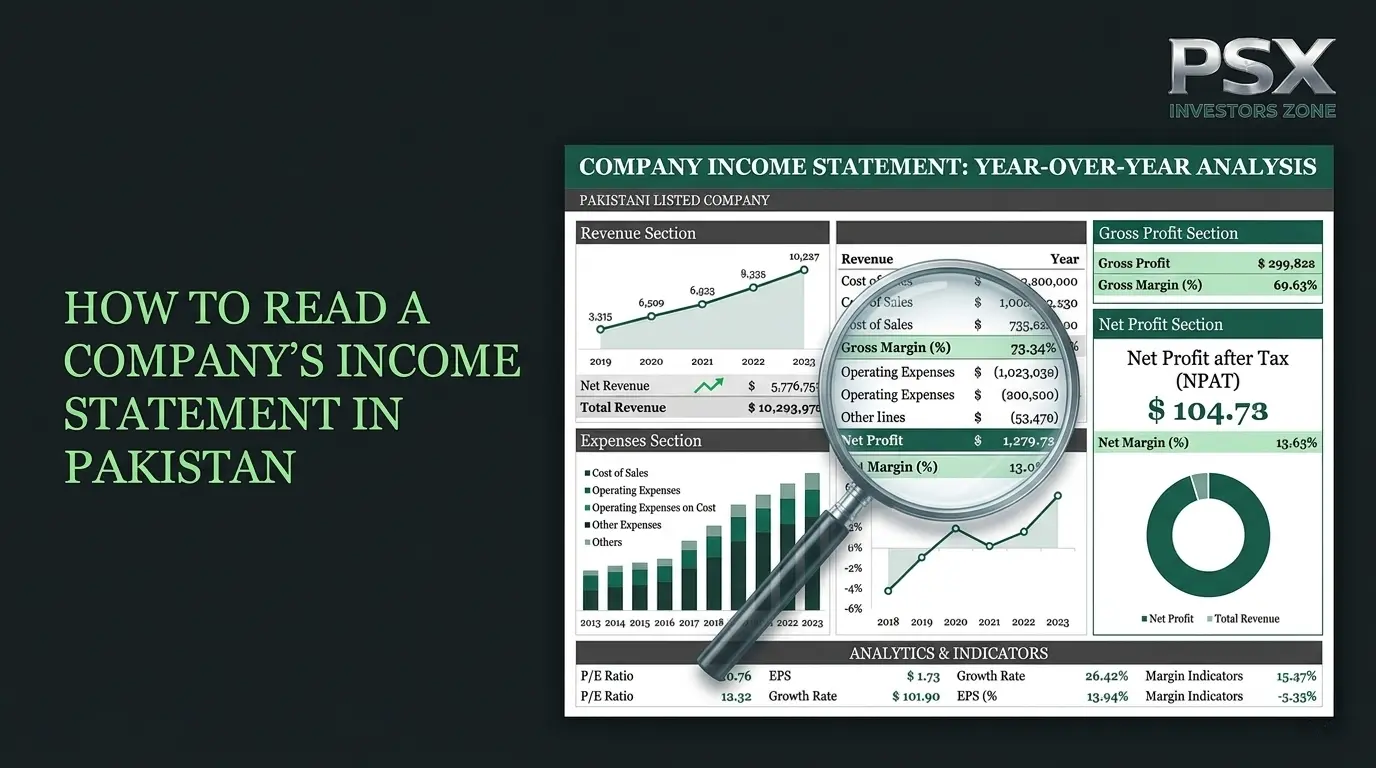
An income statement is one of the most useful financial statements for understanding how a company makes money and whether its business is becoming more or less profitable.
For PSX investors, learning how to read an income statement can help turn a company's annual or quarterly financial report into useful information for investment research.
Instead of looking only at whether a company reported a profit, investors should examine revenue, expenses, margins, finance costs, taxes and earnings per share.
What Is an Income Statement?
An income statement, also called a statement of profit or loss, summarizes a company's financial performance over a specific period.
It generally shows:
- Revenue
- Cost of sales
- Gross profit
- Operating expenses
- Operating profit
- Finance costs
- Profit before tax
- Tax expense
- Net profit
- Earnings per share (EPS)
The exact presentation can vary between companies and industries.
A simple way to understand it is:
Revenue → Costs → Profit → Tax → Net Profit
Why Is the Income Statement Important for PSX Investors?
The income statement helps investors answer important questions:
- Is the company's revenue growing?
- Is the company becoming more profitable?
- Are costs increasing faster than sales?
- Is the gross margin improving?
- Is debt creating high finance costs?
- Is net profit growing?
- Is EPS increasing?
- Are profits consistent?
These questions can help investors understand a company's financial performance before looking at its valuation.
1. Start With Revenue
Revenue represents the income generated from a company's main business activities during the reporting period.
For example, a cement company generates revenue primarily from selling cement, while a bank's income statement has a different structure reflecting its banking operations.
When analyzing revenue, compare it with previous periods.
Example
| Year | Revenue |
|---|---|
| 2024 | Rs. 10 billion |
| 2025 | Rs. 12 billion |
| 2026 | Rs. 14 billion |
Revenue increased from Rs. 10 billion to Rs. 14 billion over the period.
That indicates sales growth, but revenue growth alone does not tell you whether the company's profitability improved.
You need to continue down the income statement.
2. Analyze the Cost of Sales
Cost of sales represents costs directly associated with producing or providing the company's goods or services.
Depending on the industry, these costs may include:
- Raw materials
- Manufacturing costs
- Direct labor
- Production expenses
- Inventory-related costs
Investors should compare the growth of cost of sales with revenue growth.
If revenue increases by 20% but cost of sales increases by 35%, profitability could come under pressure.
3. Calculate Gross Profit
Gross profit is generally calculated as:
Gross Profit = Revenue − Cost of Sales
For example:
Revenue = Rs. 14 billion
Cost of sales = Rs. 9 billion
Gross profit:
Rs. 14 billion − Rs. 9 billion = Rs. 5 billion
Gross profit shows how much remains after the direct cost of producing or providing the company's products or services.
4. Understand Gross Profit Margin
Gross profit margin measures gross profit as a percentage of revenue.
Gross Profit Margin = (Gross Profit ÷ Revenue) × 100
Using the previous example:
(Rs. 5 billion ÷ Rs. 14 billion) × 100 = 35.7%
A higher gross margin can indicate that the company retains more revenue after direct costs.
However, margins should be compared with:
- Previous years
- Industry peers
- Business-cycle conditions
A margin that looks high in isolation may not necessarily be strong for that particular industry.
5. Examine Operating Expenses
After gross profit, look at operating expenses.
These may include:
- Selling and distribution expenses
- Administrative expenses
- Marketing expenses
- Employee costs
- Other operating expenses
The key question is:
Are operating expenses growing faster than revenue?
If revenue grows steadily but operating expenses increase much faster, operating profitability may decline.
6. Look at Operating Profit
Operating profit represents the profit generated from the company's core operations after relevant operating expenses.
A simplified calculation is:
Operating Profit = Gross Profit − Operating Expenses
For example:
Gross profit = Rs. 5 billion
Operating expenses = Rs. 2 billion
Operating profit = Rs. 3 billion
This figure helps investors understand the profitability of the underlying business before considering financing costs and taxes.
7. Check Finance Costs
Finance costs can be particularly important when analyzing companies with significant debt.
Finance costs may include interest and other financing-related expenses, depending on the company's reporting structure.
A company can generate strong operating profits but still have weaker earnings if financing costs consume a large portion of those profits.
Compare:
- Total debt
- Finance costs
- Operating profit
- Interest or debt-servicing capacity
This is particularly useful when analyzing highly leveraged businesses.
8. Understand Profit Before Tax
Profit before tax represents the company's earnings before income-tax expense.
A simplified calculation is:
Profit Before Tax = Profit Before Taxation
The exact presentation depends on the company's financial statements.
Compare profit before tax with previous periods to determine whether the company's profitability is improving.
9. Examine Tax Expense
The income statement normally includes an income-tax expense.
Don't automatically assume that tax expense is simply a fixed percentage of accounting profit.
Tax calculations can be affected by:
- Applicable tax rules
- Taxable income
- Tax credits
- Deferred tax
- Exemptions
- Other adjustments
For investment analysis, investors should understand whether changes in tax expense are temporary or likely to continue.
10. Focus on Net Profit
Net profit is one of the most widely watched figures in a company's financial statements.
It represents the profit attributable to the relevant period after the applicable expenses and taxes included in the income statement.
For example:
Revenue = Rs. 14 billion
Net profit = Rs. 1.8 billion
The company generated Rs. 1.8 billion in profit after the expenses and taxes reflected in its financial statements.
But don't analyze net profit alone.
Ask:
Why did net profit increase or decrease?
11. Analyze Earnings Per Share (EPS)
Earnings per share (EPS) indicates the earnings attributable to each ordinary share.
A simplified formula is:
EPS = Profit Attributable to Ordinary Shareholders ÷ Weighted Average Number of Ordinary Shares
EPS is particularly important for PSX investors because it is frequently used alongside valuation ratios such as the P/E ratio.
For example, if a company reports:
Net profit attributable to ordinary shareholders = Rs. 1 billion
Weighted average shares = 100 million
EPS:
Rs. 1 billion ÷ 100 million = Rs. 10
EPS should be analyzed over multiple periods rather than viewed as a single number.
Revenue Growth vs Profit Growth
One of the most important lessons when reading an income statement is that sales growth does not automatically mean profit growth.
Consider:
| Metric | 2025 | 2026 | Change |
|---|---|---|---|
| Revenue | Rs. 10B | Rs. 12B | +20% |
| Gross Profit | Rs. 4B | Rs. 4.2B | +5% |
| Net Profit | Rs. 1.5B | Rs. 1.2B | -20% |
Revenue increased by 20%, but net profit declined.
This could indicate rising production costs, higher operating expenses, increased finance costs, taxes or other factors.
The income statement helps you investigate the reason.
Compare Margins Over Time
Margins can reveal changes that total profit figures may hide.
Important margins include:
Gross Profit Margin
Gross Profit ÷ Revenue × 100
Operating Profit Margin
Operating Profit ÷ Revenue × 100
Net Profit Margin
Net Profit ÷ Revenue × 100
For example, if revenue grows but net profit margin declines consistently, the company may be experiencing increasing cost pressure.
Look for One-Time Gains or Losses
Not every profit increase comes from normal business operations.
A company may report gains or losses related to:
- Asset sales
- Investments
- Foreign-exchange movements
- Fair-value changes
- Legal settlements
- Other non-recurring events
When net profit changes significantly, check the notes to the financial statements to understand what caused the change.
A one-time gain should not automatically be treated as recurring operating performance.
Compare the Income Statement With Cash Flow
Profit is important, but profit is not the same as cash.
A company can report accounting profit while operating cash flow is weak.
That's why investors should examine the cash flow statement alongside the income statement.
Ask:
Is the company converting its reported profits into cash?
This is one reason free cash flow and operating cash flow can provide additional insight into financial quality.
Compare With Previous Years
A single year's income statement provides limited information.
Ideally, compare at least several reporting periods.
Look for trends in:
- Revenue
- Gross profit
- Operating profit
- Finance costs
- Profit before tax
- Net profit
- EPS
- Margins
A consistent trend can be more informative than one unusually strong or weak year.
Compare With Competitors
A company's numbers should also be compared with similar companies.
For example, if two companies operate in the same sector:
| Metric | Company A | Company B |
|---|---|---|
| Revenue Growth | 15% | 10% |
| Gross Margin | 32% | 25% |
| Net Margin | 12% | 8% |
| EPS Growth | 18% | 7% |
These figures can provide useful comparative information, but investors should also consider differences in business models, capital structure, accounting policies and company size.
Industry Matters
Income statements can look very different across sectors.
A bank does not have the same income-statement structure as:
- A cement manufacturer
- An oil and gas company
- A fertilizer producer
- A textile company
- A technology company
Therefore, investors should compare companies primarily with relevant industry peers.
Income Statement Red Flags
While reviewing a company's income statement, pay attention to:
- Revenue declining for several periods
- Costs increasing faster than revenue
- Falling gross margins
- Falling operating margins
- Rising finance costs
- Declining net profit
- Declining EPS
- Large unexplained changes
- Heavy dependence on non-recurring gains
- Profit growth without corresponding cash-flow improvement
None of these automatically means a company is a bad investment. They are signals that deserve further investigation.
A Simple Income Statement Analysis Process
A beginner can follow this sequence:
Step 1: Check revenue growth.
Step 2: Compare cost of sales with revenue.
Step 3: Calculate gross margin.
Step 4: Examine operating expenses.
Step 5: Check operating profit.
Step 6: Review finance costs.
Step 7: Check profit before tax.
Step 8: Examine tax expense.
Step 9: Analyze net profit.
Step 10: Check EPS.
Step 11: Compare margins over time.
Step 12: Compare results with competitors.
Step 13: Compare profits with operating cash flow.
This approach helps turn a long financial statement into a structured analysis.
Final Thoughts
Learning how to read an income statement is an essential skill for PSX investors.
Don't stop at the headline number that says “profit increased” or “profit decreased.”
Go deeper.
Look at revenue, costs, margins, operating profit, finance costs, taxes, net profit and EPS, and then investigate why each number changed.
Most importantly, combine income-statement analysis with the balance sheet, cash flow statement, valuation ratios and broader company research.
A strong understanding of financial statements can help investors make more informed decisions instead of relying only on market prices or stock tips.
Disclaimer: This article is for educational and informational purposes only and should not be considered financial, investment, trading, accounting or tax advice. Financial statements can be complex, and accounting treatment may vary by company and industry. Investors should conduct their own research and consult qualified professionals where appropriate.