Net Income Margin Explained: How PSX Investors Can Measure a Company’s Profitability
Introduction
Revenue growth is often one of the first things investors look at when analyzing a company.
But higher revenue does not necessarily mean higher profitability.
A company can generate billions of rupees in sales and still produce relatively little profit.
This is where Net Income Margin becomes useful.
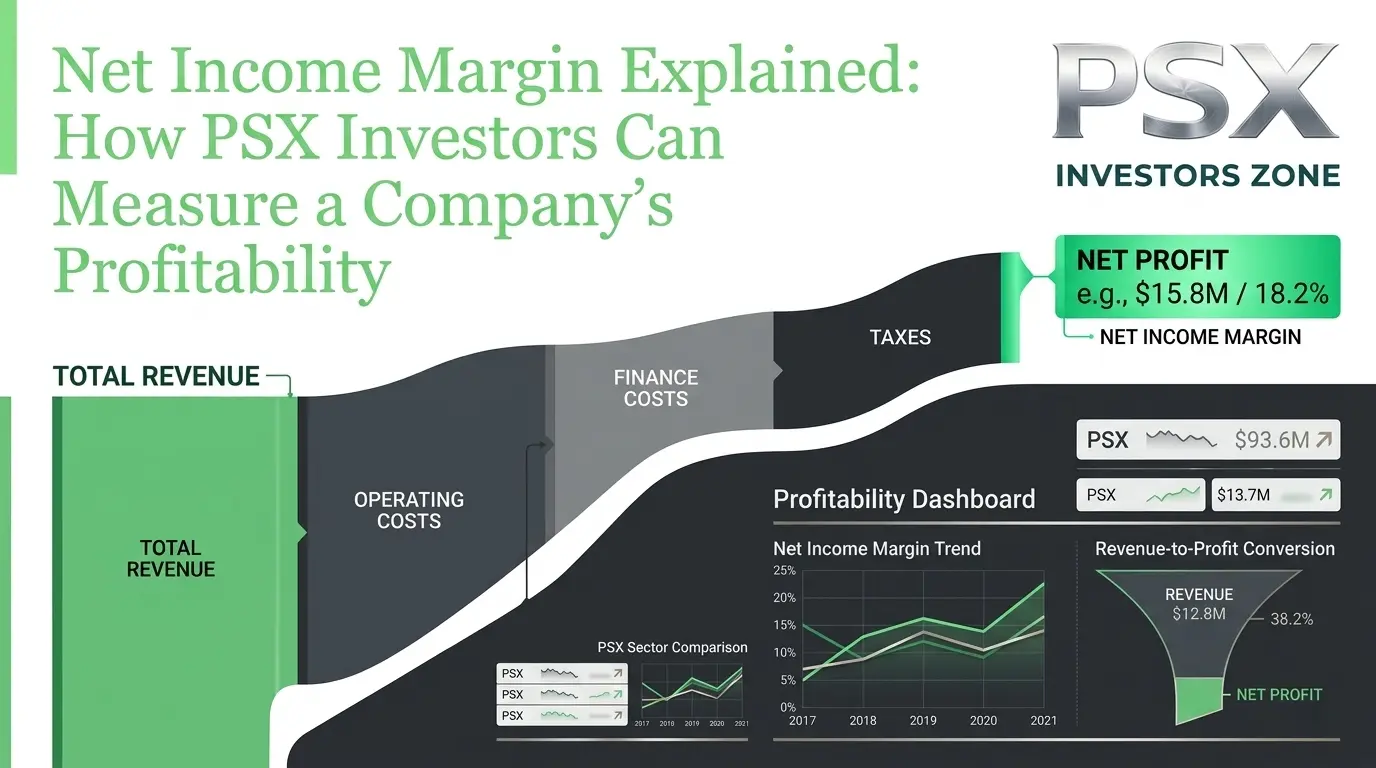
Net Income Margin measures how much net profit a company keeps from every rupee of revenue after accounting for its expenses.
The basic formula is:
Net Income Margin = Net Income ÷ Revenue × 100
For PSX investors, this ratio can help answer an important question:
How efficiently does the company convert its sales into bottom-line profit?
Net Income Margin should not be analyzed alone. Investors should also consider:
- Revenue growth
- Gross margin
- Operating margin
- EPS
- ROE
- Debt
- Interest expense
- Tax expense
- Free cash flow
- Industry conditions
Important: This article is for educational purposes only and does not recommend any specific PSX stock or guarantee investment returns.
What Is Net Income Margin?
Net Income Margin, also called Net Profit Margin, shows the percentage of revenue that remains as net income after all relevant expenses.
These expenses can include:
- Cost of goods sold
- Operating expenses
- Interest expenses
- Taxes
- Other expenses
For example, if a company generates Rs. 100 million in revenue and earns Rs. 10 million in net income:
Net Income Margin = Rs. 10 million ÷ Rs. 100 million × 100
Net Income Margin = 10%
This means the company retains approximately Rs. 10 in net income for every Rs. 100 of revenue.
Net Income Margin Formula
The basic formula is:
Net Income Margin = Net Income ÷ Revenue × 100
Example
Suppose a PSX company reports:
- Revenue: Rs. 50 billion
- Net income: Rs. 5 billion
Then:
5 ÷ 50 × 100 = 10%
The company's Net Income Margin is therefore 10%.
What Does a High Net Income Margin Mean?
A higher net income margin generally means the company is keeping more profit from each rupee of revenue.
For example:
Company A: 5%
Company B: 15%
If both companies operate in similar industries and have comparable accounting policies, Company B is generating more net profit from each rupee of sales.
However, a higher margin does not automatically mean Company B is the better investment.
Investors should also consider:
- Growth
- Debt
- Valuation
- Cash flow
- Competitive position
- Sustainability of margins
What Does a Low Net Income Margin Mean?
A low net income margin means a smaller portion of revenue becomes net profit.
This may happen because of:
- High production costs
- High operating expenses
- High interest expenses
- High taxes
- Weak pricing power
- Strong competition
- High energy costs
A low margin is not necessarily a problem.
Some industries naturally operate with lower margins but generate large sales volumes.
This is why industry comparison is essential.
Net Income Margin Example for a PSX Investor
Suppose a company reports:
Revenue = Rs. 100 billion
Net Income = Rs. 8 billion
Therefore:
Net Income Margin = 8%
Now suppose the following year:
Revenue = Rs. 120 billion
Net Income = Rs. 12 billion
The new margin becomes:
12 ÷ 120 × 100 = 10%
The company has achieved:
- Revenue growth
- Net income growth
- Margin expansion
This combination can be more informative than revenue growth alone.
Margin Expansion
When Net Income Margin increases, it is called margin expansion.
For example:
2024: 7%
2025: 9%
2026: 11%
This may indicate improving profitability.
Potential reasons include:
- Higher selling prices
- Lower input costs
- Better operating efficiency
- Lower interest expenses
- Lower taxes
- Improved product mix
- Economies of scale
Investors should identify the actual reason behind the improvement.
Margin Compression
The opposite is margin compression.
For example:
2024: 12%
2025: 10%
2026: 7%
This means the company is keeping less profit from each rupee of revenue.
Potential causes include:
- Rising costs
- Lower selling prices
- Higher wages
- Higher energy costs
- Higher interest expenses
- Increased competition
- Higher taxes
Again, investors should determine whether the decline is temporary or structural.
Net Income Margin vs Gross Margin
These two ratios measure profitability at different stages.
Gross Margin
Measures profit after direct costs associated with producing goods or services.
Gross Margin = Gross Profit ÷ Revenue × 100
Net Income Margin
Measures profit remaining after the company's broader expenses.
Net Income Margin = Net Income ÷ Revenue × 100
A company can have a strong gross margin but a weak net margin if operating expenses, interest or taxes are high.
Net Income Margin vs Operating Margin
Operating margin measures profitability from core operations before certain non-operating items such as interest and taxes.
Net Income Margin goes further down the income statement.
Therefore:
Operating Margin → Net Income Margin
If operating margin remains stable but net margin falls significantly, investors should investigate factors such as:
- Interest expenses
- Finance costs
- Taxes
- Non-operating losses
- Other expenses
Net Income Margin and EPS
EPS measures profit on a per-share basis.
Net Income Margin measures profit as a percentage of revenue.
For example:
A company may have:
Net Income Margin = 12%
and:
EPS = Rs. 15
The two metrics provide different information.
Margin tells you about profitability relative to sales.
EPS tells you about earnings attributable to each share.
Using both can provide a more complete picture.
Net Income Margin and ROE
ROE measures how efficiently a company generates profit from shareholders' equity.
ROE = Net Income ÷ Average Shareholders' Equity × 100
Net Income Margin measures profit relative to revenue.
A company can have:
High Net Margin + High ROE
which may indicate strong profitability and efficient use of shareholder capital.
But investors should also examine whether high ROE is being driven by excessive debt.
Net Income Margin and Debt
Debt can have a significant impact on net income margin.
Suppose a company has substantial borrowing.
Higher interest rates or larger debt balances can increase finance costs.
That can reduce:
Net Income
and therefore:
Net Income Margin
This is why investors should analyze net margin together with:
- Debt-to-equity
- Interest coverage
- Finance costs
- Cash flow
Net Income Margin and Interest Rates
For highly leveraged companies, changes in interest rates can affect profitability.
If borrowing costs rise:
Interest Expense ↑
↓
Net Income ↓
↓
Net Income Margin ↓
Conversely, lower financing costs can potentially support net profitability.
The impact depends on the company's debt structure and interest-rate exposure.
Net Income Margin and Revenue Growth
Revenue growth is not always enough.
Consider two companies:
Company A
Revenue growth: 20%
Net margin: 4%
Company B
Revenue growth: 10%
Net margin: 15%
Company A is growing faster.
Company B is considerably more profitable.
Which is better?
There is no automatic answer.
Investors must consider:
- Valuation
- Growth sustainability
- Industry
- Cash flow
- Debt
- Competitive advantage
The lesson is:
Growth and profitability should be analyzed together.
Why Margin Trends Matter More Than One Number
A single year's net margin may not tell the full story.
Suppose a company's margins are:
| Year | Net Income Margin |
|---|---|
| 2023 | 8% |
| 2024 | 9% |
| 2025 | 10% |
| 2026 | 11% |
The trend suggests improving profitability.
Now consider:
| Year | Net Income Margin |
|---|---|
| 2023 | 14% |
| 2024 | 13% |
| 2025 | 10% |
| 2026 | 7% |
The second company is experiencing margin compression.
Trend analysis can therefore be more useful than looking at a single year's figure.
How to Find Net Income Margin in a PSX Company
You can calculate it using the company's financial statements.
Step 1: Find Revenue
Look at the company's income statement.
Step 2: Find Net Income
Find profit after tax or the appropriate net income attributable to the relevant shareholders.
Step 3: Apply the Formula
Net Income Margin = Net Income ÷ Revenue × 100
Use consistent reporting periods when comparing companies.
A Practical Example
Imagine a PSX company reports:
Revenue: Rs. 80 billion
Net Income: Rs. 6.4 billion
Calculation:
6.4 ÷ 80 × 100 = 8%
The company has an 8% Net Income Margin.
Now imagine its competitor reports:
Revenue: Rs. 60 billion
Net Income: Rs. 6 billion
Its margin is:
6 ÷ 60 × 100 = 10%
The second company generates less revenue but has a higher net margin.
This demonstrates why investors should not judge a company simply by its revenue size.
How to Compare Two PSX Companies
When comparing companies, calculate:
- Net Income Margin
- Revenue growth
- EPS growth
- ROE
- Operating margin
- Free cash flow
- Debt-to-equity
- Interest coverage
- P/E ratio
- P/B ratio
Then ask:
Which company has stronger and more sustainable profitability at a reasonable valuation?
Industry Comparison Is Essential
Net margins can vary significantly across industries.
For example:
- Banks
- Cement companies
- Fertilizer companies
- Oil & gas companies
- Technology companies
- Retail businesses
can have very different cost structures and profitability profiles.
Therefore, compare a company primarily with:
- Direct competitors
- Industry averages
- Its own historical performance
rather than applying one universal "good margin" number.
Can a High Net Margin Be a Warning Sign?
Sometimes.
An unusually high margin may result from:
- One-time gains
- Asset sales
- Investment gains
- Foreign-exchange gains
- Tax benefits
- Other non-recurring items
For this reason, investors should examine the income statement carefully.
A sustainable operating business is generally more valuable than a company whose reported profit depends heavily on one-off gains.
Can a Low Net Margin Still Be Attractive?
Yes.
A company with low current margins may have potential for improvement.
For example:
Net Margin = 3%
If management successfully improves:
- Pricing
- Costs
- Capacity utilization
- Efficiency
the margin could expand.
But investors should not buy based solely on the possibility of future improvement.
There should be evidence supporting the investment thesis.
Net Margin and Operating Efficiency
Improving efficiency can increase net income margin.
Examples include:
- Lower production costs
- Better inventory management
- Reduced administrative expenses
- Improved capacity utilization
- Lower distribution costs
If revenue remains stable while expenses decline, net income can increase.
Net Margin and Pricing Power
Pricing power is another important factor.
Companies with strong brands, competitive advantages or limited competition may have greater ability to maintain prices.
If a company can increase prices without losing significant demand, its margins may improve.
But investors should determine whether higher prices are sustainable.
Net Margin and Inflation
Inflation can affect both revenue and costs.
A company may increase prices and report higher revenue.
But if:
Costs rise faster than selling prices
the net margin can decline.
Therefore, investors should examine real margin performance rather than focusing only on nominal revenue growth.
Net Margin and Currency Movements
For companies exposed to foreign currencies, exchange-rate movements can influence profitability.
A weaker PKR can:
- Increase imported input costs
- Increase foreign debt costs
- Potentially increase export revenue in rupee terms
The overall impact depends on the company's business model and currency exposure.
Net Margin and Free Cash Flow
Profitability does not automatically equal cash generation.
A company may report:
High Net Income Margin
but generate:
Weak Free Cash Flow
because cash is being absorbed by:
- Receivables
- Inventory
- Capital expenditure
This is why investors should combine profitability analysis with cash-flow analysis.
A Simple PSX Profitability Checklist
Before investing, ask:
Revenue
Is sales growth sustainable?
Gross Margin
Is the company controlling direct costs?
Operating Margin
Is the core business becoming more efficient?
Net Income Margin
How much profit remains after expenses?
EPS
Is profit growing on a per-share basis?
ROE
Is shareholder capital being used efficiently?
Free Cash Flow
Is accounting profit translating into cash?
Debt
Is leverage manageable?
Valuation
Is the market price reasonable?
Common Mistakes When Using Net Income Margin
Mistake 1: Looking at Revenue Alone
Large revenue does not guarantee high profitability.
Mistake 2: Comparing Different Industries
Margin structures can differ dramatically.
Mistake 3: Looking at One Year
A single year may be affected by temporary factors.
Mistake 4: Ignoring Debt
Interest expenses can significantly affect net income.
Mistake 5: Ignoring One-Time Gains
Temporary gains can artificially increase net margin.
Mistake 6: Ignoring Cash Flow
Profit does not automatically mean strong cash generation.
Mistake 7: Ignoring Valuation
A highly profitable company can still be overpriced.
Net Income Margin for Shariah-Compliant Investors
Net Income Margin is a fundamental-analysis metric.
It does not determine whether a company is Shariah-compliant.
Shariah-conscious PSX investors should separately verify:
- Core business activity
- Latest Shariah screening status
- Applicable debt criteria
- Interest-related income
- Other relevant financial-screening requirements
Therefore:
Profitability Analysis + Financial Analysis + Valuation + Shariah Screening
should be considered together.
Key Takeaways
- Net Income Margin measures net profit as a percentage of revenue.
- The formula is Net Income ÷ Revenue × 100.
- A higher margin generally means more profit is retained from each rupee of sales.
- A lower margin is not automatically bad because industry economics differ.
- Margin trends can be more useful than a single year's figure.
- Margin expansion can indicate improving profitability.
- Margin compression can indicate rising costs or weakening pricing power.
- Net margin should be analyzed alongside gross and operating margins.
- EPS and ROE provide additional perspectives on profitability.
- Debt and interest expenses can significantly affect net income.
- Strong net margin does not guarantee strong free cash flow.
- One-time gains can temporarily inflate profitability.
- PSX investors should compare margins with competitors and historical performance.
- Shariah compliance requires separate screening and should not be inferred from profitability ratios.
Frequently Asked Questions
What is Net Income Margin?
Net Income Margin measures how much net profit a company generates from its revenue.
What is the Net Income Margin formula?
Net Income Margin = Net Income ÷ Revenue × 100
What does a 10% net margin mean?
It means the company generates approximately Rs. 10 of net income for every Rs. 100 of revenue.
Is a higher net margin always better?
Not necessarily. Investors should compare companies within the same industry and consider growth, debt, cash flow and valuation.
What is the difference between net margin and gross margin?
Gross margin measures profitability after direct costs, while net margin measures profit remaining after broader expenses, including relevant operating, financing and tax costs.
Why does net margin matter for PSX investors?
It helps investors evaluate how efficiently a company converts revenue into bottom-line profit.
Can net margin increase while revenue falls?
Yes. If costs decline faster than revenue, net income can increase as a percentage of sales even when total revenue falls.
Can a company have high net margin but weak cash flow?
Yes. Accounting profit and cash generation are different. Working capital and capital expenditure can affect cash flow.
Conclusion
Net Income Margin is one of the most useful profitability metrics for PSX investors because it shows how much of a company's revenue ultimately becomes net profit.
The calculation is simple:
Net Income Margin = Net Income ÷ Revenue × 100
But effective analysis requires going beyond the formula.
Investors should examine:
Margin Trend
Revenue Growth
Operating Efficiency
Debt
Interest Costs
EPS
ROE
Free Cash Flow
Industry Position
Valuation
A company with rising revenue but declining margins may face increasing cost pressure.
A company with stable revenue and expanding margins may be improving its efficiency and profitability.
However, even strong profitability does not automatically make a stock a good investment.
The market price, future growth expectations, financial risk and sustainability of earnings all matter.
For long-term PSX investors, the best approach is to use Net Income Margin as part of a broader fundamental-analysis framework rather than relying on it alone.
For Shariah-conscious investors, current Shariah screening should also be independently verified before making an investment decision.
Educational Disclaimer: This article is for educational purposes only and does not constitute financial, investment, legal, tax or Shariah advice. Investing in the Pakistan Stock Exchange involves risk, including possible loss of capital. Financial results, market conditions and Shariah-screening classifications can change. Always verify the latest company financial statements, PSX disclosures, valuation data and applicable Shariah-screening information before making investment decisions.